Have you ever wondered how a customer shops on your Shopify store? Imagine being able to watch their shopping journey in real-time, seeing exactly how they navigated your store, understanding what caught their eye and watching what they clicked on. The good news is, you can.
Microsoft Clarity is a powerful analytical tool that records and visualises customers shopping experiences on your Shopify store to provide a deep insight into user behaviour. It’s easy to install, even easier to use and better yet, it’s completely free.
Here at Wonder, we use Microsoft Clarity as a core tool for optimising the user experience across our client’s Shopify stores. Clarity provides us with a detailed understanding of how customers navigate and engage with each site, which we then turn into actionable insights that our clients can use to make smarter decisions. It’s an invaluable tool for providing detailed user behaviour data that has allowed us to uncover opportunities to refine site design, streamline navigation and improve customer journeys.
We want to share our insights on using Microsoft Clarity so that Shopify merchants and marketing managers like you can make the most of this powerful tool, and uncover ways to improve store performance, optimise customer experiences and boost conversions with data-driven decisions. You can expect to find out;
Table of Contents
What Is Microsoft Clarity Used For?
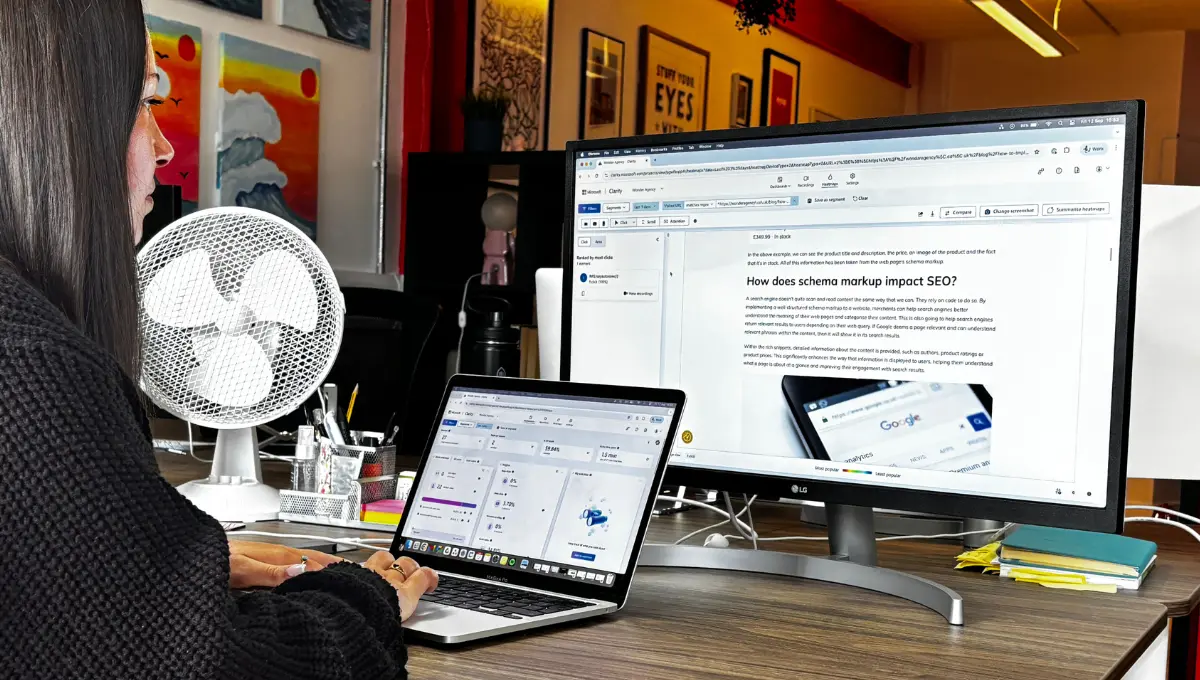
First things first, let’s talk a little about what Microsoft Clarity is used for and how, as a Shopify store owner or marketing manager, it can help you. As a behavioral analytics tool, Clarity gathers detailed insights on how users are interacting with your website. What we love most about Clarity is not only the depth of the information it offers, but how visual and easy to understand it is.
Clarity provides you with session recordings, meaning you can watch exactly how a user navigates your Shopify store and see exactly what they’ve clicked on, where they’ve moved their mouse and where they get stuck on a page. Clarity also provides heatmaps, which show how far users scroll down your web pages and where they click the most, giving you an understanding of what features and content they’re engaging with most.
Having this visual representation of user behaviour quickly allows you to understand how users are interacting with different elements of your website and easily identify which areas need work. This may mean fixing a bug, redesigning a web page and making layout adjustments or optimising on-page content to ensure it’s as relevant as possible. And if you’re running A/B tests on a particular feature of a webpage design, Clarity is a great tool for analysing results of these tests and determining how those changes are performing.
Microsoft Clarity vs. Google Analytics
A question we see commonly asked is what is the difference between Microsoft Clarity and Google Analytics? And most importantly, should I be using both or is one better than the other? While both are free tools designed to monitor and measure user behaviour on your store, they serve different purposes.
Google Analytics (GA4) provides quantitative data, helping you to gain an understanding of where your website visitors come from, how long they stay on your website and which pages they’re visiting. You can use GA4 to generate reports that show how users are navigating across your website and the paths that they took to trigger key events, but you can’t see exactly how they interacted with those pages.
Microsoft Clarity however focuses on providing qualitative data through session recordings and heatmaps. Here you can visually see how users are moving through your website and discover opportunities for improvement that numbers alone might not reveal.
Ultimately, Google Analytics helps you to understand what is happening on your Shopify store while Clarity shows you why it’s happening. We recommend using both tools together as you’ll gain a bigger picture of your website’s performance and be better equipped to make informed, data-driven optimisations.
Creating A Project In Microsoft Clarity
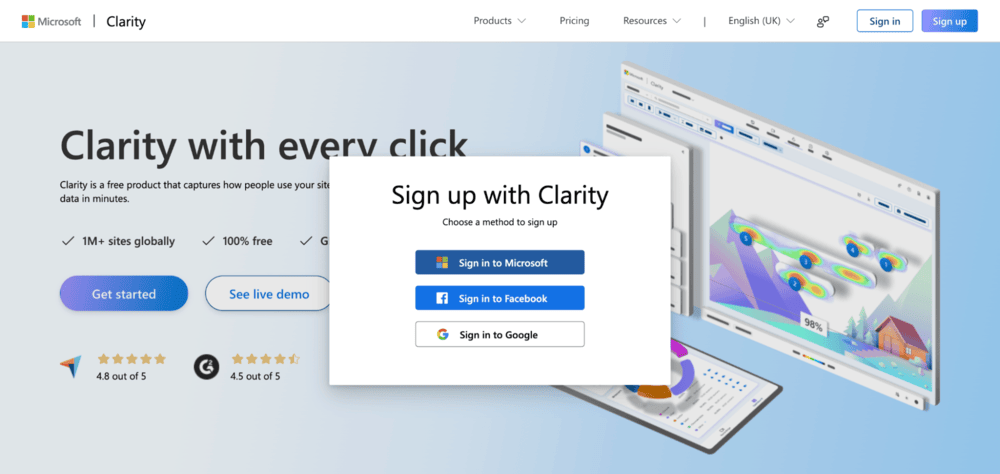
Let’s move onto getting Microsoft Clarity installed on your Shopify website. First of all, you need to make an account on Clarity and create a project by heading to the Microsoft Clarity website and choosing one of the sign up methods. Be aware that you will need either a Microsoft, Facebook or Google account as there’s no option to sign up with just an email address.
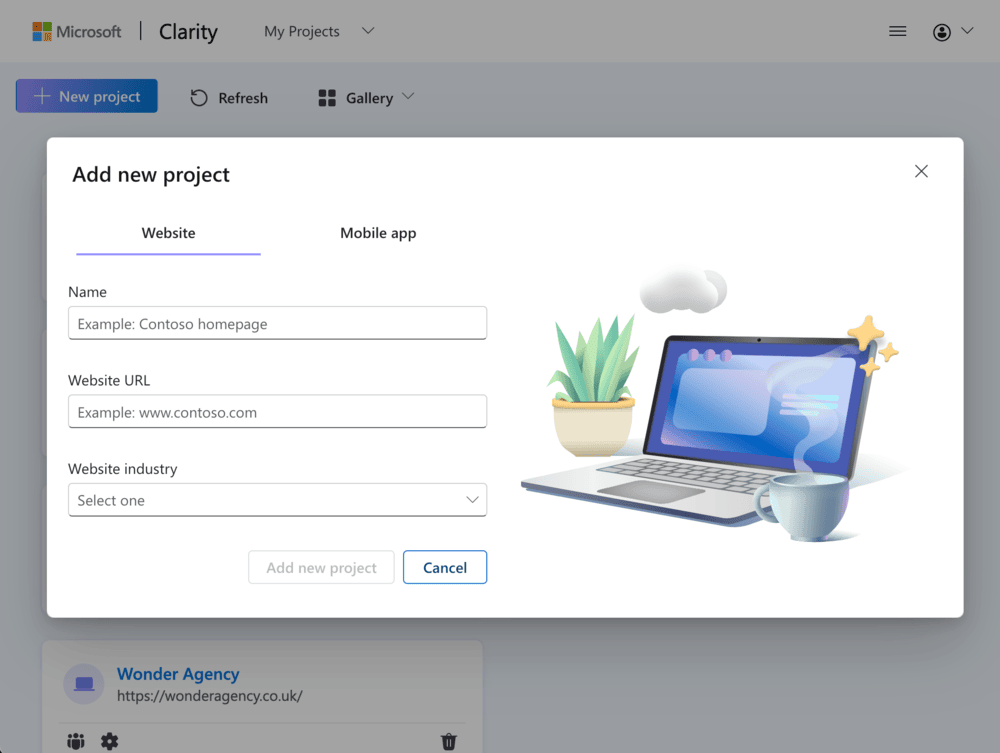
After choosing a sign up method and following the login steps, you will be taken to a screen where you can add a new project. Here you choose between Website or Mobile app. Mobile app allows you to install Clarity on Native Android, Native iOS, React Native, Cordova and Ionic apps.
As we’ll be installing Clarity onto a Shopify store however, we’ll be selecting the default option: Website.
To create a project, add a Name for the project, the Website URL where Clarity will be installed and select the Website industry.
How To Install Microsoft Clarity On Shopify
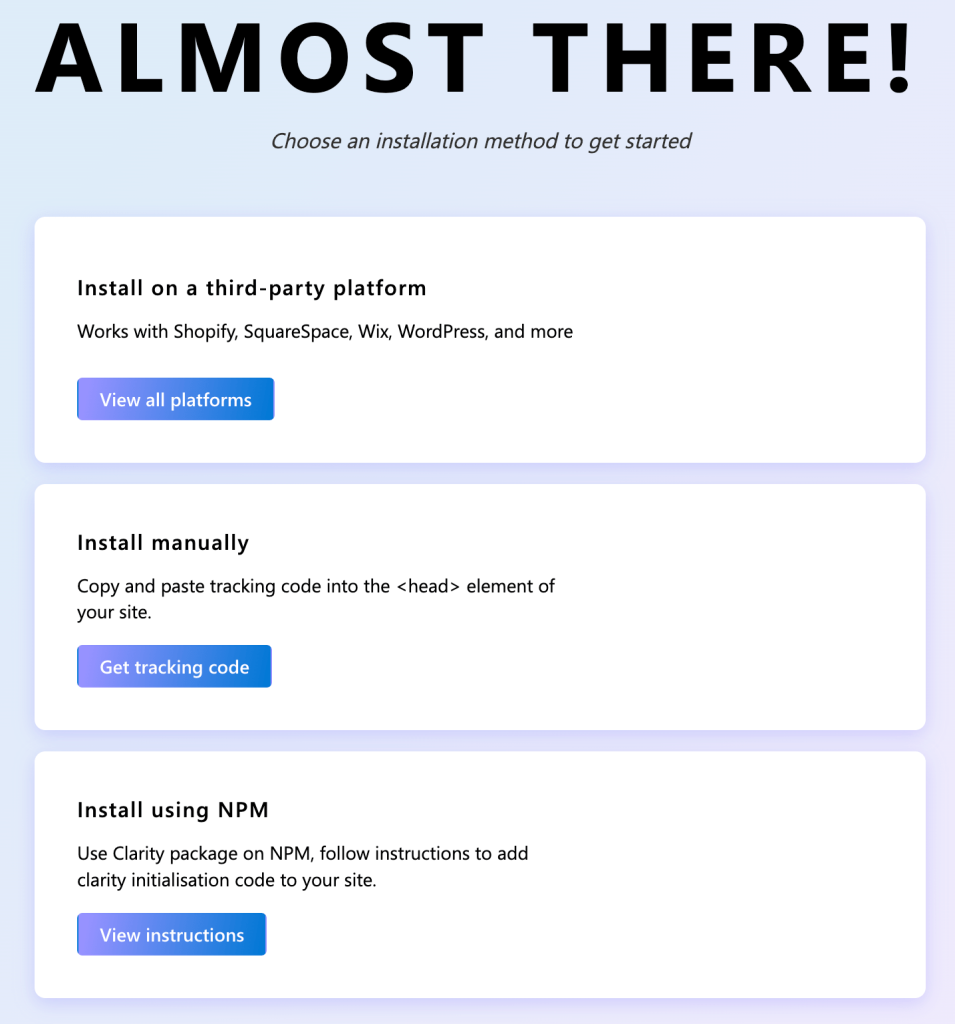
Once you have created the new project, you will be given multiple installation methods to put the Clarity code onto your website. If you know what you’re doing with code, click the Get tracking code button under the Install manually section.
This will display your unique tracking code which you can copy and paste directly into the of your website, using whichever method suits you.
If you would prefer to follow a step by step guide for a specific platform, click on the View all platforms button under the Install on a third-party platform section.
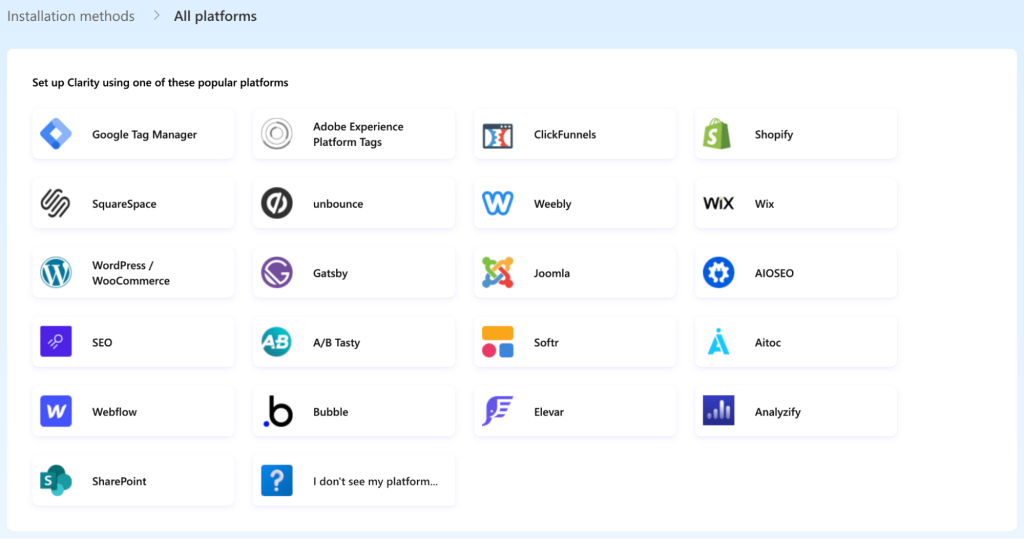
As you can see, Shopify is one of the platforms listed and while some of these installation instructions are still relevant, beyond point 8 is actually using functionality which has been deprecated in Shopify and will be removed in June 2026. For this reason, we don’t recommend following these steps for installing Microsoft Clarity on Shopify.
The instructions listed on the Clarity learning portal are also using deprecated features and so we don’t recommend following these either, unless you only want to implement behaviour tracking for customers before they reach the checkout process, following steps 1 to 8.
There is a note near the top of those instructions about Shopify’s new web pixels, which are often used for tracking and have replaced Shopify Scripts. We’ve previously written about Shopify web pixels on our blog but as of May 2025, unfortunately they don’t track correctly for Microsoft Clarity. Microsoft and Shopify are currently working together to resolve this issue, but there isn’t a timeline as to when this will be fixed.

Installing Microsoft Clarity Using Google Tag Manager
If you’re already using Google Tag Manager on your Shopify store, this is the easiest way to add Clarity without having to edit any code files. This is the approach we recommend and use here at Wonder. If you however aren’t using Google Tag Manager, Shopify has written a tutorial on how to add it to your store using a custom web pixel.
From the getting started page in your Clarity project, click the View all platforms button on the Install on a third-party platform section and then select Google Tag Manager.
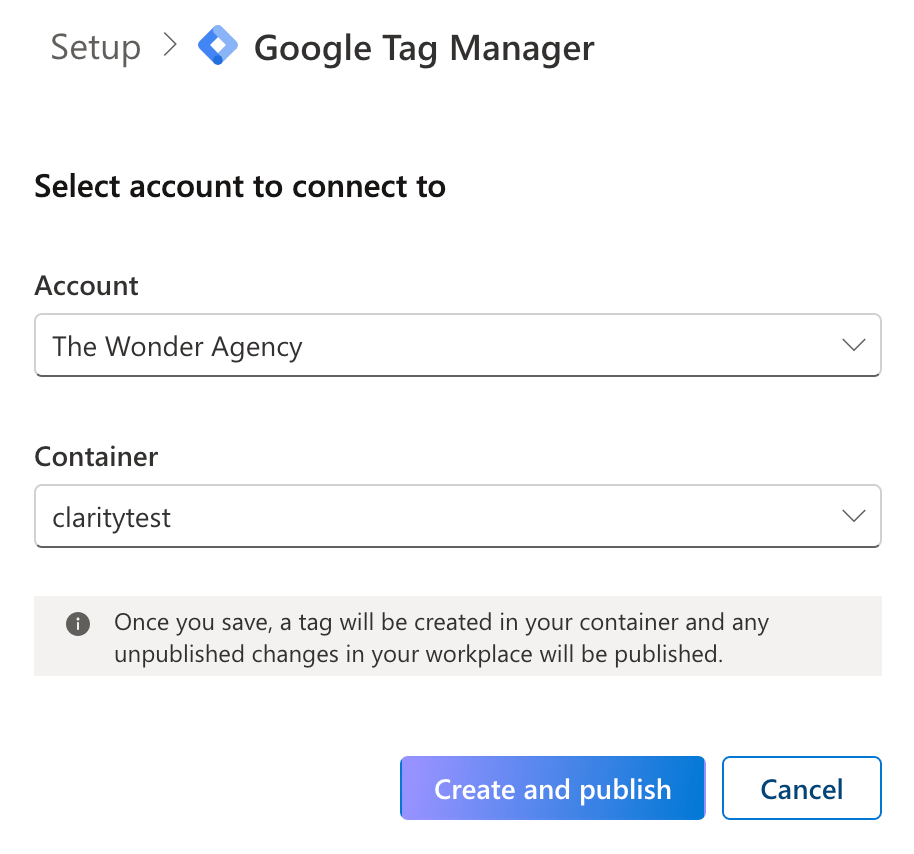
If you are logged in using a Google account, you will be shown a list of GTM accounts and containers which you have access to. Select the Google Tag Manager Account and Container from the drop down lists and click the Create and publish button. Clicking this button will create a tag in your container and any unpublished changes will be put live. So, if you have any changes in your container that you don’t want to publish, make sure you remove these first.
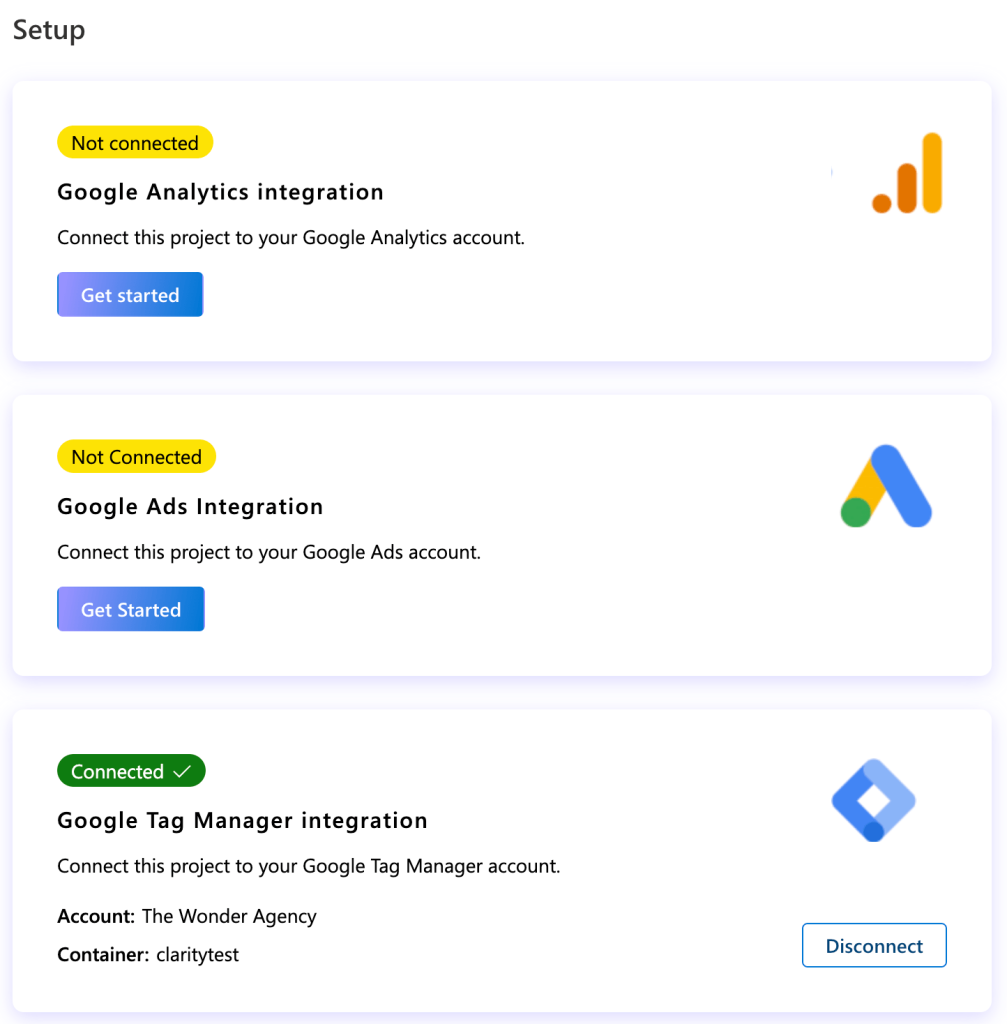
Once you’ve clicked the Create and publish button, you will be taken to the Settings > Setup page. From here you can see that the Google Tag Manager integration is connected and also integrates directly with Google Analytics and Google Ads, which can be useful for reviewing customer behaviour based on your segments from Analytics and Ads.
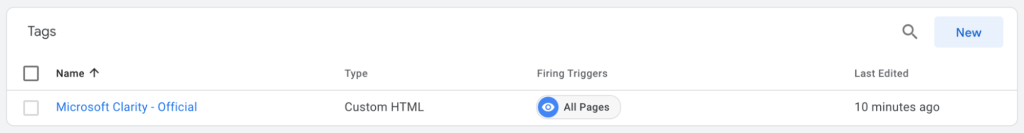
If you now access your Google Tag Manager container and click on Tags, you will see a tag called Microsoft Clarity – Official. This is a Custom HTML tag and will contain some JavaScript which inserts the Clarity code onto your store.
Microsoft Clarity and Cookie Consent
If you’re planning on adding Microsoft Clarity to your Shopify store, it’s important to ensure you’re collecting user consent – particularly for sessions coming from the EEA, UK and Switzerland. Privacy laws are frequently evolving and 2024 saw a major shift in the use of cookies. Businesses are now required to get consent from users before using non-essential cookies, such as those for analytics and marketing. Additionally, businesses must make it easy for visitors to reject cookies if they don’t want to consent to tracking.
As Clarity’s tracking code uses cookies to gather session data, it falls under the category of non-essential cookies. This means that any website, not just Shopify stores, that uses Microsoft Clarity to track behaviour data must ensure they’ve updated their cookie consent banners and are compliant with consent mode v2.
Microsoft Clarity however took things one step further and required all businesses to implement the Clarity Consent API. This API sends a direct consent signal to Clarity, ensuring that it only activates tracking when a user has given permission. Without explicit consent from a user, Clarity’s cookies won’t function, meaning session recordings and behavioural data for those users won’t be captured.
How To Use Microsoft Clarity to Optimise Your Shopify Store
Now that you’re all set up with Microsoft Clarity, it’s time to review the data. We’ve already mentioned some of the features that Clarity offers, but let’s take a look at them in more detail and what they can be used for.
How To Use Heatmaps in Microsoft Clarity to Gain Insights into Your Shopify Store
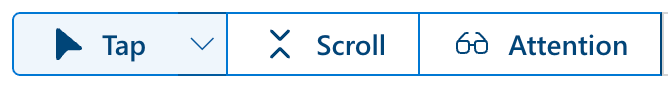
Heatmaps offer a visual representation of where users are clicking, scrolling and spending the most time on your Shopify store pages. Clarity uses colour to show the different levels of user activity on a web page across three different types of heatmaps: tap (or click), scroll and attention. Warmer colours such as red and orange indicate that this an area of your web page users interact with most, while cooler colours such as blue represent a lower level of activity.
You can analyse heatmaps across mobile, tablet and desktop to understand how shoppers are engaging with your store across all devices. This will help you identify areas for improvement and make changes where necessary. Clarity also allows you to switch between different screenshots of the same page, which is useful if you’re testing dynamic content, such as promotions or product variations, and want to see which is performing better.
Tap (Click) Heatmaps
Tap heatmaps are useful for identifying which parts of your Shopify pages users are clicking the most. This helps to understand which features, CTA buttons and products are driving the most engagement and encourage users to click through to the next page. On the flip side, tap heatmaps are also useful for identifying which buttons, features and bits of content aren’t performing well, giving you actionable insights to inform your strategy and optimise them.
Rage Clicks and Dead Clicks
One of the most beneficial features of Clarity heatmaps is the ability to identify dead clicks and rage clicks. Dead clicks happen when users click on an element that didn’t trigger any action while rage clicks identify areas of a page users have repeatedly tapped, indicating frustration or confusion.
Dead clicks are mostly beneficial for identifying any misleading design elements, such as a product image or button that looks clickable, but isn’t. A dead click may also happen because a user accidentally clicks elsewhere when trying to interact with small tap targets or elements spaced too closely together. Issues like these can annoy and decrease trust with customers as well as lead to lost sales opportunities.
It’s important to regularly review Clarity tap heatmaps for dead clicks and see where they’re happening as this could highlight potential conversion or click-through opportunities. Adding a link to a product image or a promotional banner, or making boxes on a form bigger, are quick and simple fixes, but ones that could yield big results. However, not every dead click requires a fix. Focus on areas that have consistent dead clicks across multiple user sessions, as these patterns will reveal elements that are misleading or users are struggling with.
Rage clicks on the other hand will provide insight into user frustration and where customers are experiencing pain points on your site. For example, if a user is frequently clicking a button, it could indicate a technical issue or a slow-loading script that is preventing an action from occurring. By identifying these areas and passing them onto your development team to fix, you can reduce user frustration, improve overall satisfaction and increase the chance of conversions.
Attention Heatmaps
Attention heatmaps show how much time, on average, users spend on a certain section of a page. This feature can be used to understand which areas of your page are capturing users’ attention and which parts are losing their interest. These insights will help you to optimise the layout and content placement on your pages. For example, if you have an important piece of information about a product or a promotional offer that users are missing, it’s likely that this needs moving to a more prominent area on the page.
Using Session Recordings In Microsoft Clarity to Unlock Data from Your Shopify Store
Possibly the best tool that Microsoft Clarity offers is session recordings. Here you are provided with a video replay of a customer’s visit to your Shopify store.. You can watch a customer’s real-time journey through your website, seeing where they’ve scrolled, what they clicked on and which pages they visited. This allows you to identify pain points in the shopping experience and witness firsthand how customers are interacting with your store.
Clarity stores session recordings for 30 days, which can quickly add up to a lot of recordings to go through. Watching through each recording can be time consuming, so that’s where Clarity’s AI summary tool comes in handy. Using either the top 10 sessions or a customised selection, Clarity will analyse your recordings and provide you with an overview of achievements, what was unsuccessful and key takeaways for improvements.
How To Use Filters and Segments In Microsoft Clarity to Analyse Shopify Store Performance
For a deeper understanding of how customers are interacting with your Shopify store, use Clarity’s powerful filtering and segmentation options. Let’s say you notice that traffic to your store is high over the weekend, yet conversions are low. With Clarity, you can select filters that break down this audience to see why this might be happening. All the reports in the dashboard will automatically adjust to this view, including heatmaps and sessions.
There are several filtering options available in Clarity (over 30 in fact) that you can use to drill down into specific user behaviours. For example, you can filter sessions from visitors who have landed on a particular product page or analyse how visitors who arrive from a certain campaign or marketing channel behave once they’re on your store.
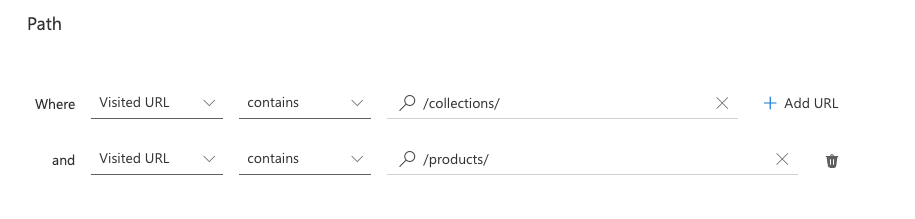
On a Shopify store, it’s most likely that you’re going to want to understand customer behaviour on pages that lead to conversions, such as product pages, collection pages and the homepage. Rather than crawling through thousands of sessions to find this information, here you can create a filtered segment based on Shopify page structures to access quick insights. To do so, navigate to the ‘Path’ section in the filters and create a segment for URLs that contain /products/ and /collections/.
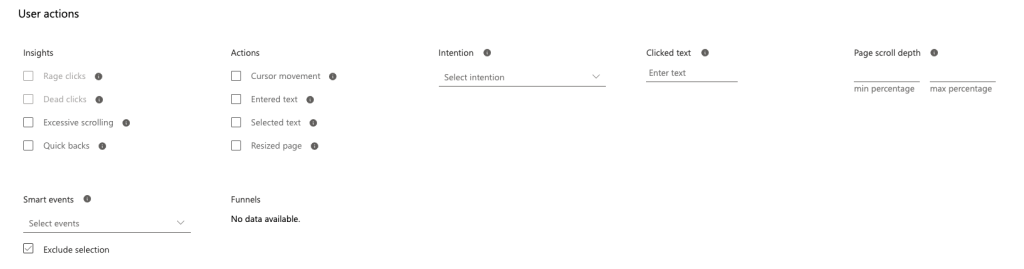
Additionally, you can build filters based on specific actions that customers have taken. For example, you may want to understand why customers are abandoning their carts and identify potential pain points in the checkout process. Similarly, if you want to understand what’s driving conversions and how you can improve this, you can segment users who have completed a purchase, clicked on a key CTA or signed up for a newsletter. This is done by navigating to the User Actions section in the filter options and selecting smart events. Here a list of actions will appear such as Checkout, Add to cart or Sign up, which have been automatically defined as smart actions by Clarity.

After building a filter view that you find useful, you can save this as a segment and return to this breakdown whenever you need to.
How To Analyse and Action Microsoft Clarity Data for Shopify Stores
You’ve gathered the data, now let’s analyse it. Interpreting the data collected through Microsoft Clarity provides real value in understanding what strategic decisions to make in order to optimise the user experience of your Shopify store. But first, you need to establish your objectives for what you want to achieve.
Are you looking to increase conversion rates, reduce abandoned carts, improve page engagement, or identify technical issues? Creating specific goals will help you focus your efforts on a certain area and prioritise which insights to act on first. We recommend taking note of the initial metrics as a baseline, so you can measure the impact of any changes you implement.
Analysing Shopify Heatmaps In Microsoft Clarity
If your tap heatmaps are showing high-activity on elements that are non-clickable, this immediately indicates a problem that user intent isn’t being fulfilled. For example, if users are frequently clicking on a product image expecting it to open into a more detailed view, consider making these images clickable to improve user experience.
As previously mentioned, Clarity provides three different types of heatmaps. It’s important to pay attention to the relationship between different heatmap types and insights each one offers. If an attention heatmap shows that users are spending significant time in one area, but a tap heatmap reveals low interaction, there may be a disconnect between user interest and incentive to take action. In this instance, consider reviewing CTAs and interactive elements. It may be that they need moving elsewhere on the page or optimising to be more relevant and enticing.
For scroll heatmaps, pay attention to the percentage drop-off points and the on-page content that correlates to them. Identifying where users stop scrolling can reveal if important information, relevant CTAs or product details are being missed from the page. If a significant number of users drop off before reaching key content, consider repositioning it higher up the page or adjusting the copy to be more compelling and engaging.
Analysing Shopify Session Recordings In Microsoft Clarity
As we mentioned earlier, Clarity can capture a lot of session recordings and it can be difficult to view each one individually. This is where we’re going to make the most of Clarity’s filtering and segmentation. Some of the key segments you’re going to want to create in Clarity can be found in the User Actions tab. Some segments we recommend analysing include Checkout, Add To Cart and High Intent.
When reviewing recordings in these categories, note common patterns where users hesitate, how they navigate between pages and what triggers them to exit. Look for recurring pain points such as confusing layouts, unexpected pop-ups or slow loading pages, that might cause users to abandon their journey.
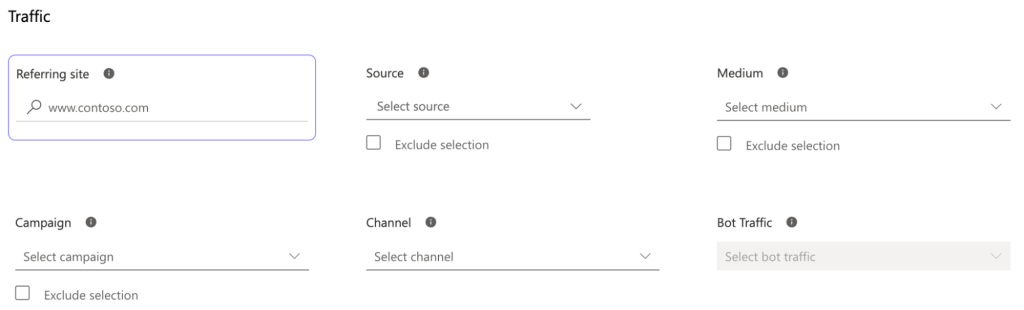
In addition to tracking key actions, Clarity’s filtering capabilities can help uncover insights based on user types and traffic sources. Using options in the User Info and Traffic sections, create segments based on user characteristics such as device type, traffic source, campaign and channel. By segmenting your analysis in this way, it’s often revealed that different user groups behave in distinct ways and have unique needs.
For example, you might discover that mobile users arriving from Meta or Pinterest Ads have a high bounce rate on your homepage, while desktop users coming from organic search engage more with your product pages. Insights like these highlight the importance of tailoring your optimisation strategies to suit different audiences. Based on this data, you may look to develop engaging, simple landing pages for social media campaigns while developing content on product pages to drive further organic traffic.
Ultimately, understanding how customers interact with a Shopify store is one of the most valuable insights a business owner or marketer can have. Tools like Microsoft Clarity make it easier than ever to access this data and uncover patterns that impact user behaviour and sales. By turning this data into actionable insights, such as optimising content, improving page layouts or fixing functionality, you can make meaningful, customer-focused improvements to your Shopify website that both enhance the shopping experience and drive better business results. The outcome is higher engagement, increased conversions and stronger overall store performance. So, if you haven’t already explored the insights Microsoft Clarity can offer, now’s the perfect time to see what a difference it can make to turn user behaviour data into concrete growth.